Are you flying blind with your
financial planning practice?
Most firms spend hours every week pulling data from 5+ different systems,
just to understand basic firm metrics like revenue, client growth, and advisor performance.
What's this costing your business?

Are you flying blind with your
financial planning practice?
Most firms spend hours every week pulling data from 5+ different systems, just to understand basic firm metrics like revenue, client growth, and advisor performance.
What's this costing your business?
Are you flying blind with your
financial planning practice?
Most firms spend hours every week pulling data from 5+ different systems,
just to understand basic firm metrics like revenue, client growth, and advisor performance.
What's this costing your business?
The Hidden Cost of
Manual Business Reporting

Every hour you spend logging into different systems, exporting data to Excel, and trying to piece together your firm's performance is an hour you're not growing your firm. At $200 - $400 per hour billing rates, manual business analytics is costing most firms $15,000 - $30,000 annually in lost productivity.
Here's what we hear from Financial Planning Firm Owners:
"I have no idea if we're hitting our growth targets until month-end"
"I spend weekends trying to figure out which advisors are performing"
"Our data lives in 6 different systems - CRM, portfolio management, billing…"
"I make business decisions based on gut feeling not real data"
save 8+ hours weekly
Stop manually pulling firm performance data
Make Decisions 3x Faster
Automated dashboards versus month-end excel reports
Increase Revenue 20%
Data driven growth versus guesswork
The Hidden Cost of
Manual Business Reporting
Every hour you spend logging into different systems, exporting data to Excel, and trying to piece together your firm's performance is an hour you're not growing your firm. At $200 - $400 per hour billing rates, manual business analytics is costing most firms $15,000 - $30,000 annually in lost productivity.
Here's what we hear from Financial Planning Firm Owners:
"I have no idea if we're hitting our growth targets until month-end"
"I spend weekends trying to figure out which advisors are performing"
"Our data lives in 6 different systems - CRM, portfolio management, billing…"
"I make business decisions based on gut feeling not real data"
save 8+ hours weekly
Stop manually pulling firm performance data
Make Decisions 3x Faster
Automated dashboards versus month-end excel reports
Increase Revenue 20%
Data driven growth versus guesswork
Your New Workflow
Your New Workflow
Your New Workflow
Save Hours Every Week
Save Hours Every Week
Save Hours Every Week
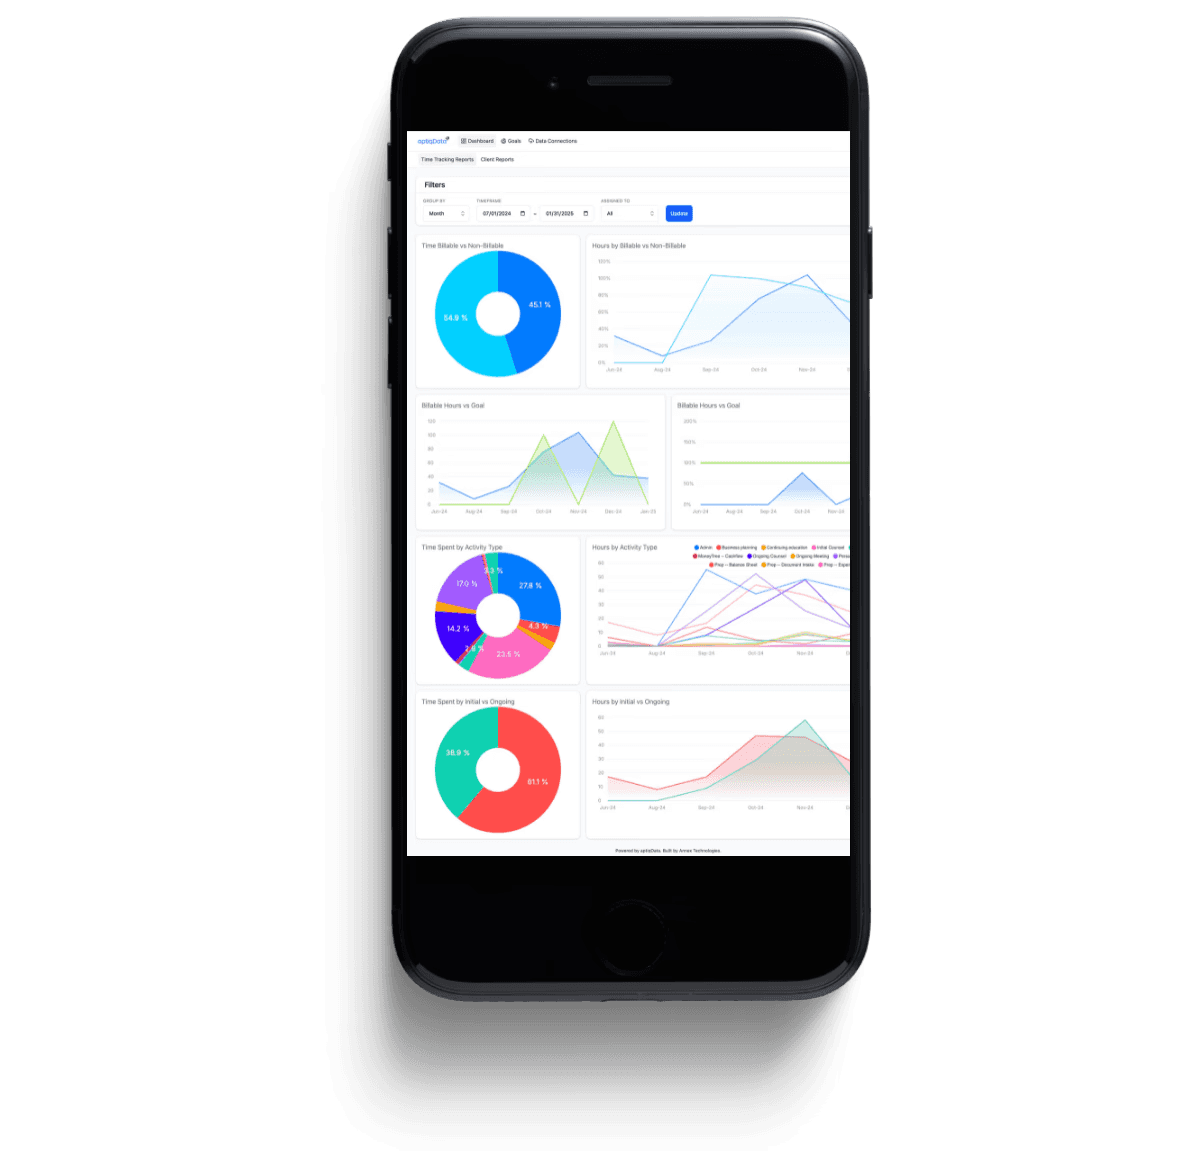
No more exporting to Excel. aptiq pulls data automatically from your existing systems and centralizes it in clean dashboards.
No more exporting to Excel. aptiq pulls data automatically from your existing systems and centralizes it in clean dashboards.
No more exporting to Excel. aptiq pulls data automatically from your existing systems and centralizes it in clean dashboards.
Clarity Without Complexity
Clarity Without Complexity
Clarity Without Complexity
You'll see what's working (and what's not) at a glance, across clients, revenue, performance, and firm-wide KPIs.
You'll see what's working (and what's not) at a glance, across clients, revenue, performance, and firm-wide KPIs.
You'll see what's working (and what's not) at a glance, across clients, revenue, performance, and firm-wide KPIs.
No Spreadsheets. No Guesswork.
No Spreadsheets. No Guesswork.
No Spreadsheets. No Guesswork.
Automated reports + secure storage = data you can trust without lifting a finger.
Automated reports + secure storage = data you can trust without lifting a finger.
Automated reports + secure storage = data you can trust without lifting a finger.
Focus on Goals That Matter
Focus on Goals That Matter
Focus on Goals That Matter
Track client outcomes, firm performance, and advisor KPIs all in one place.
Track client outcomes, firm performance, and advisor KPIs all in one place.
Track client outcomes, firm performance, and advisor KPIs all in one place.
How it Works
How it Works
How it Works
Connect your tools (CRM, tracking software)
Connect your tools (CRM, tracking software)
Connect your tools (CRM, tracking software)
We build your dashboards customized to your needs.
We build your dashboards customized to your needs.
We build your dashboards customized to your needs.
Automated Reporting begins, no manual entry needed.
Automated Reporting begins, no manual entry needed.
Automated Reporting begins, no manual entry needed.
You make smarter decisions with reliable data.
You make smarter decisions with reliable data.
You make smarter decisions with reliable data.
Is aptiqData worth it for your firm?
Is aptiqData worth it for your firm?
Is aptiqData worth it for your firm?
Use our quick calculator to estimate the ROI of automating your reporting.
Use our quick calculator to estimate the ROI of automating your reporting.
Use our quick calculator to estimate the ROI of automating your reporting.